IBM: Anomaly Detection and Root Cause Analysis
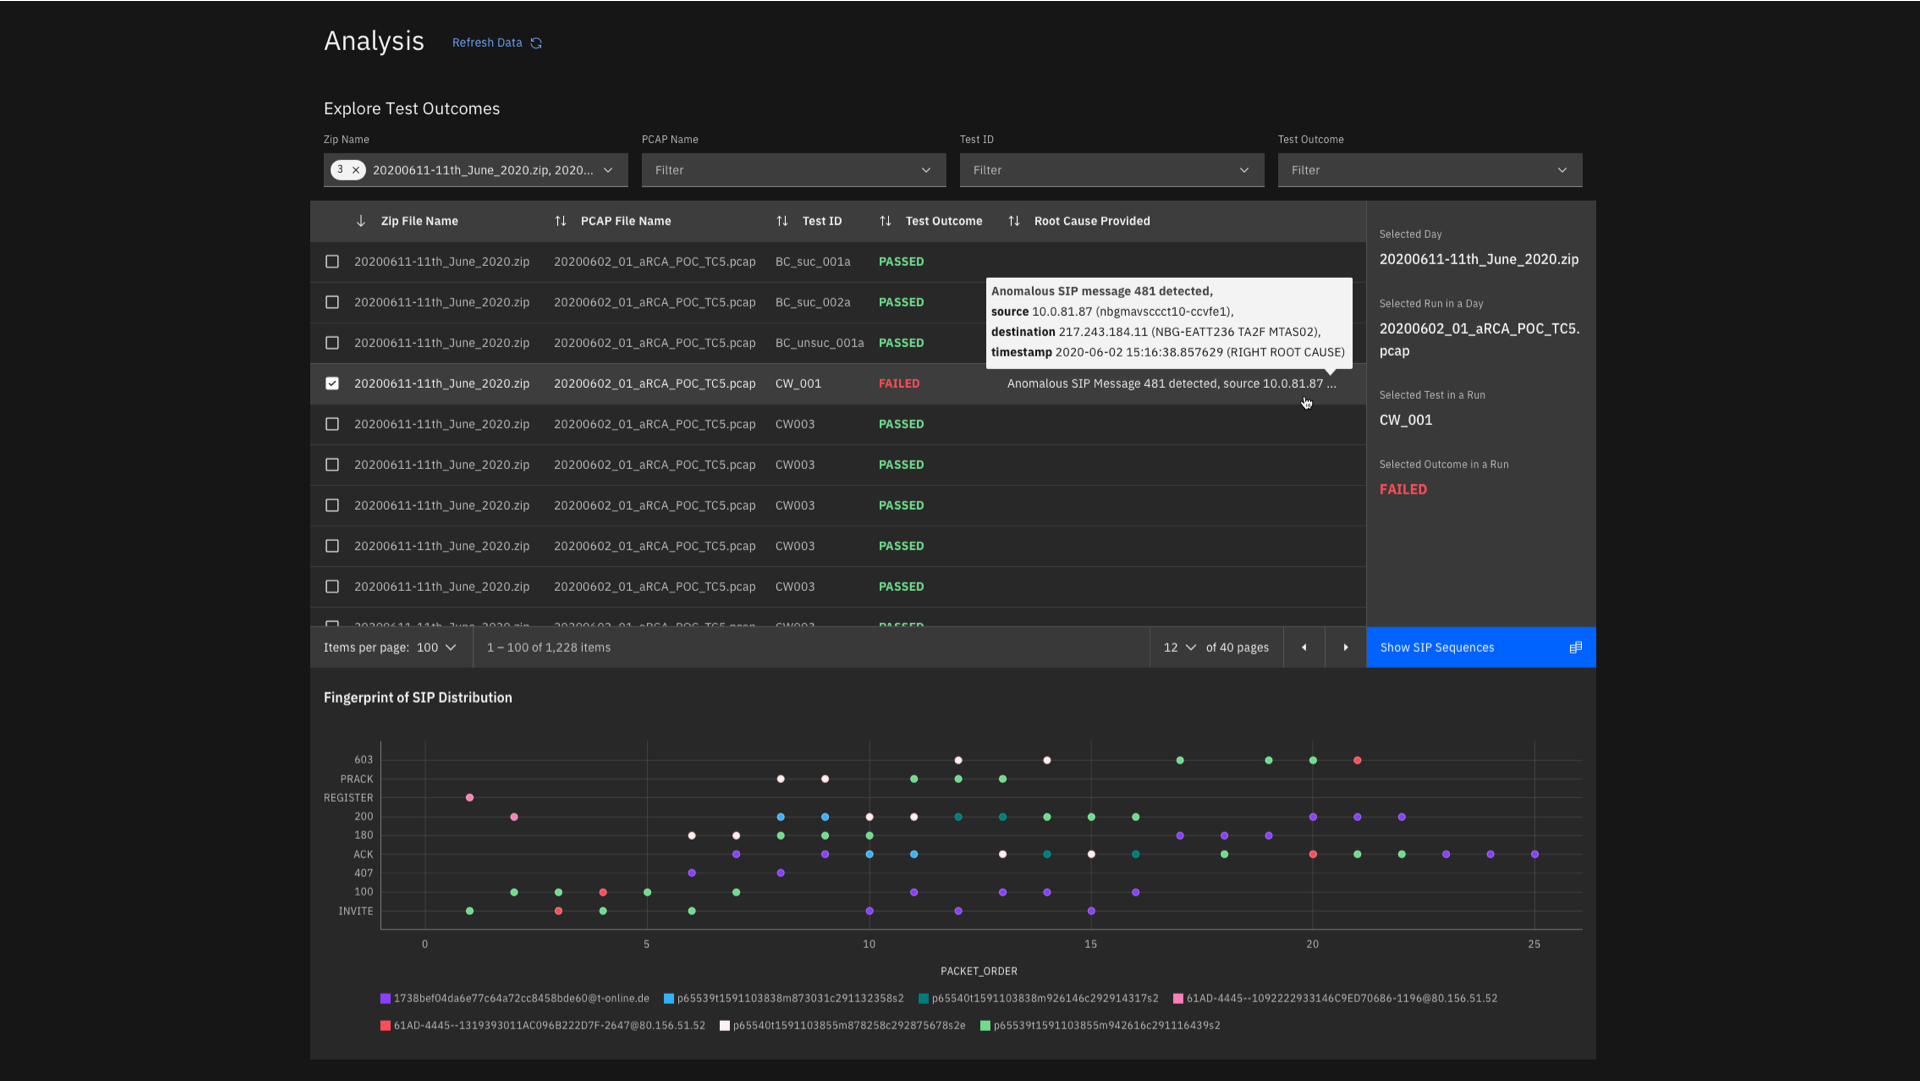
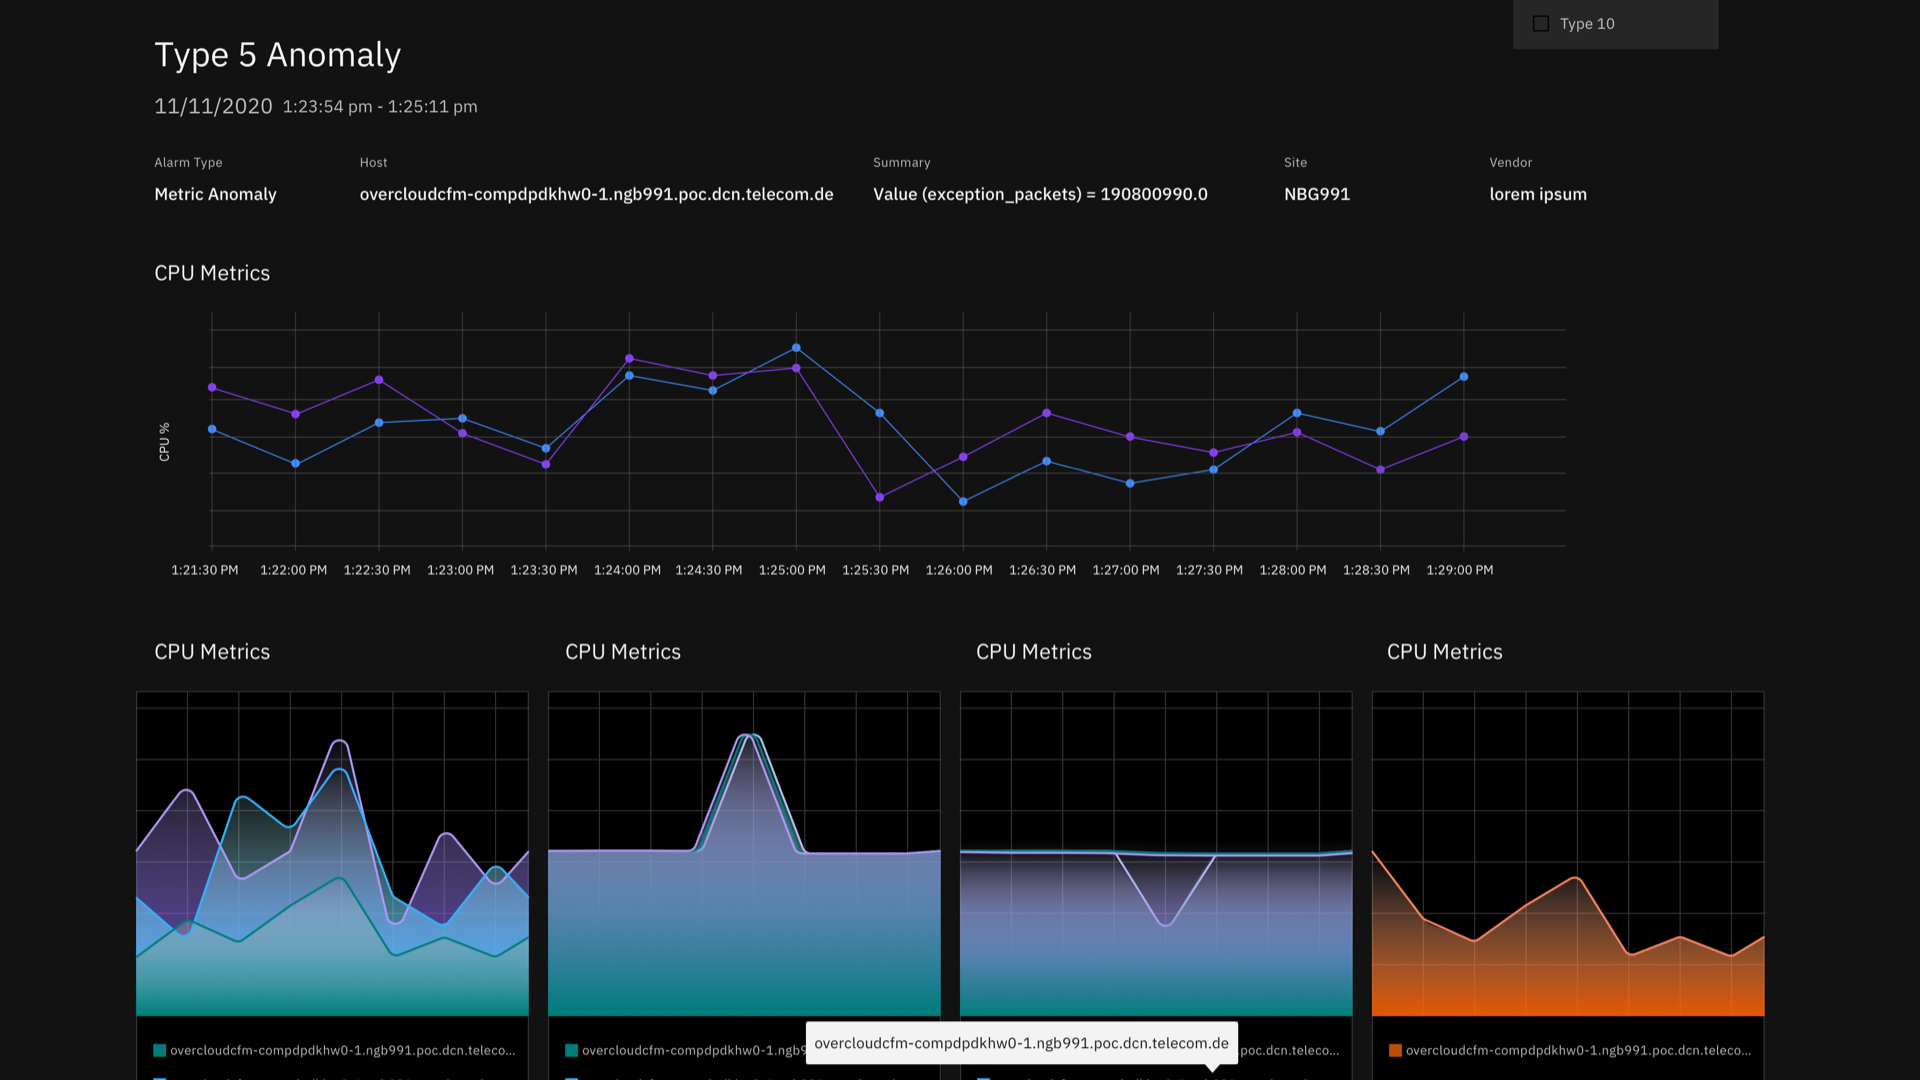
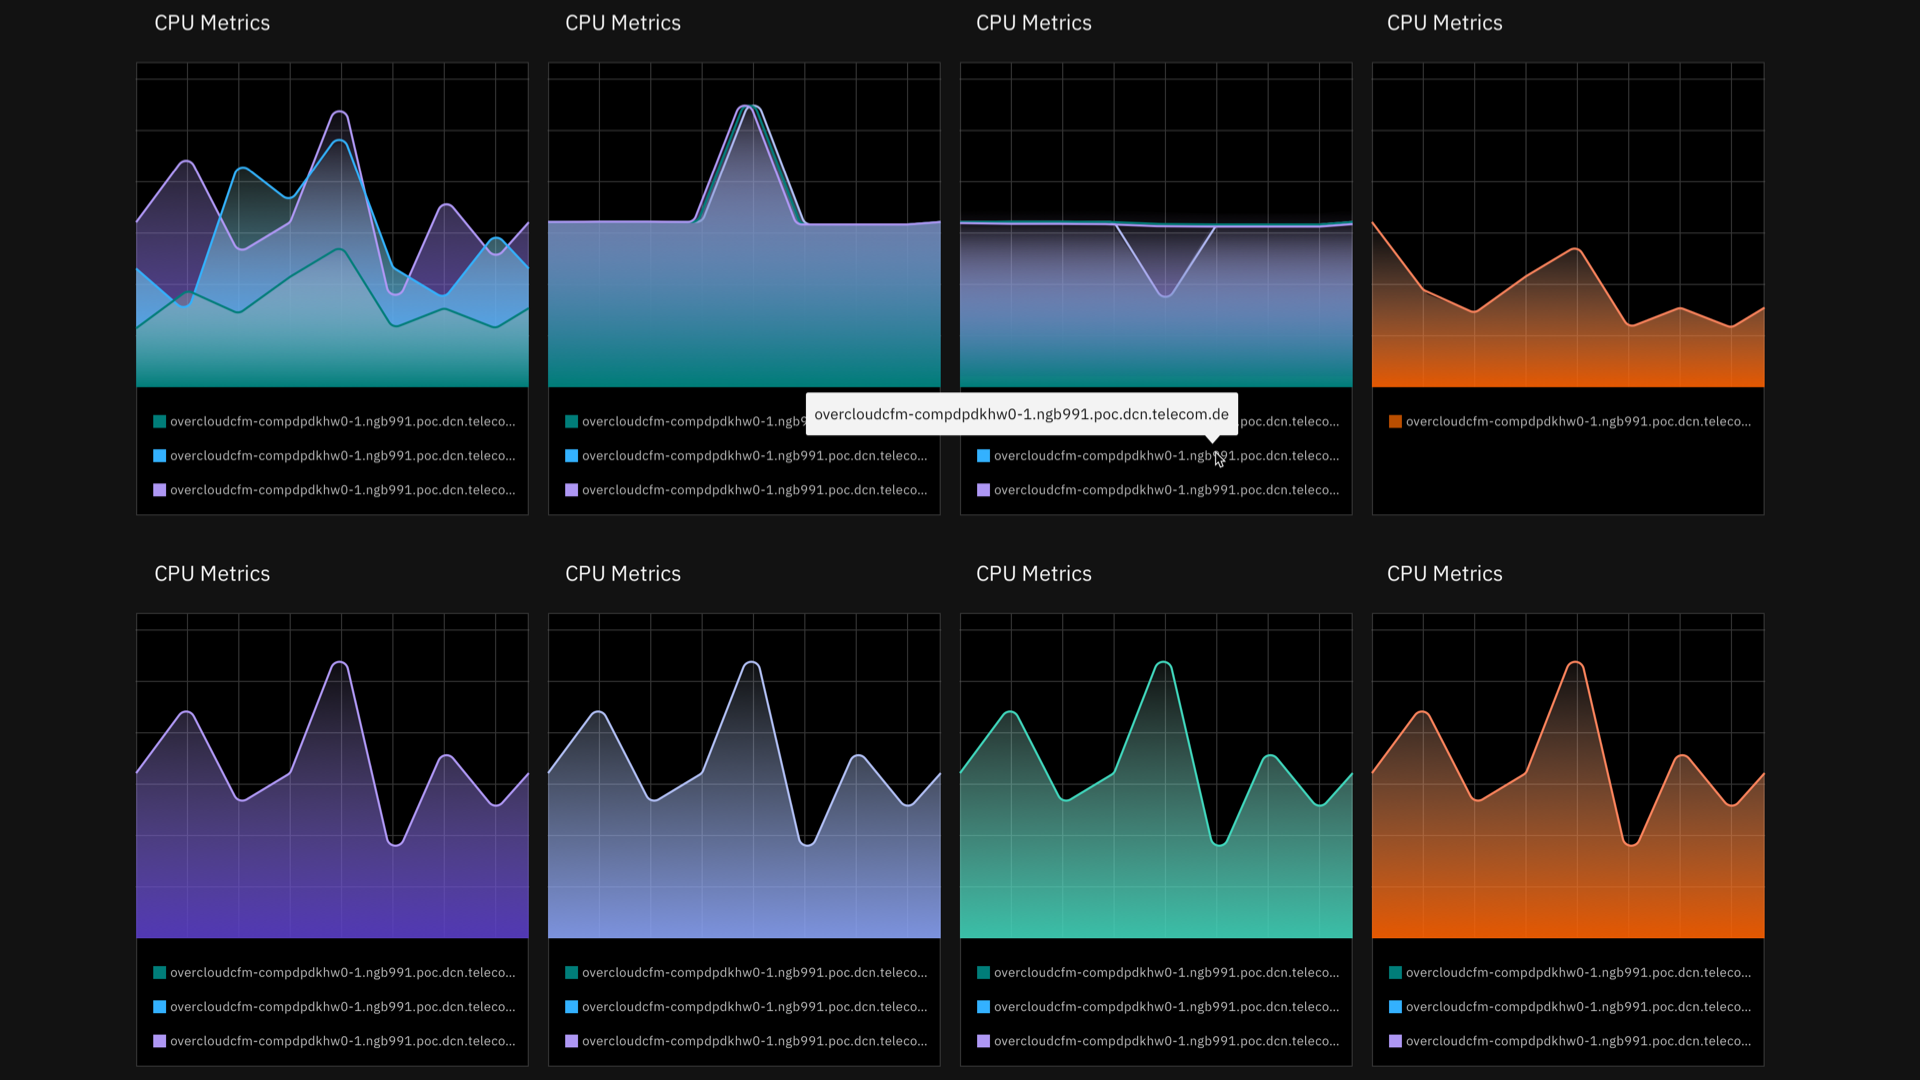
My team and I were approached by the Telecommunications Solutions team at IBMs Global Industry Solution Center to design the UI and data visualizations for an industry solution identifying and determining the root cause of anomalies present in network data. The system addresses this through two broad use cases: Validation and Operation. Validation involves analyzing PCAP files during test runs and determining cause for test failures, while Operations analyzes real time streaming alarms and metrics for anomalies. The dashboard showcases insights from metrics, sys-logs and alarms data present in network devices and functions. This dashboard was used in collaboration with a telecom company to showcase IBM's faster method of detecting issues/anomalies and Root cause analysis.
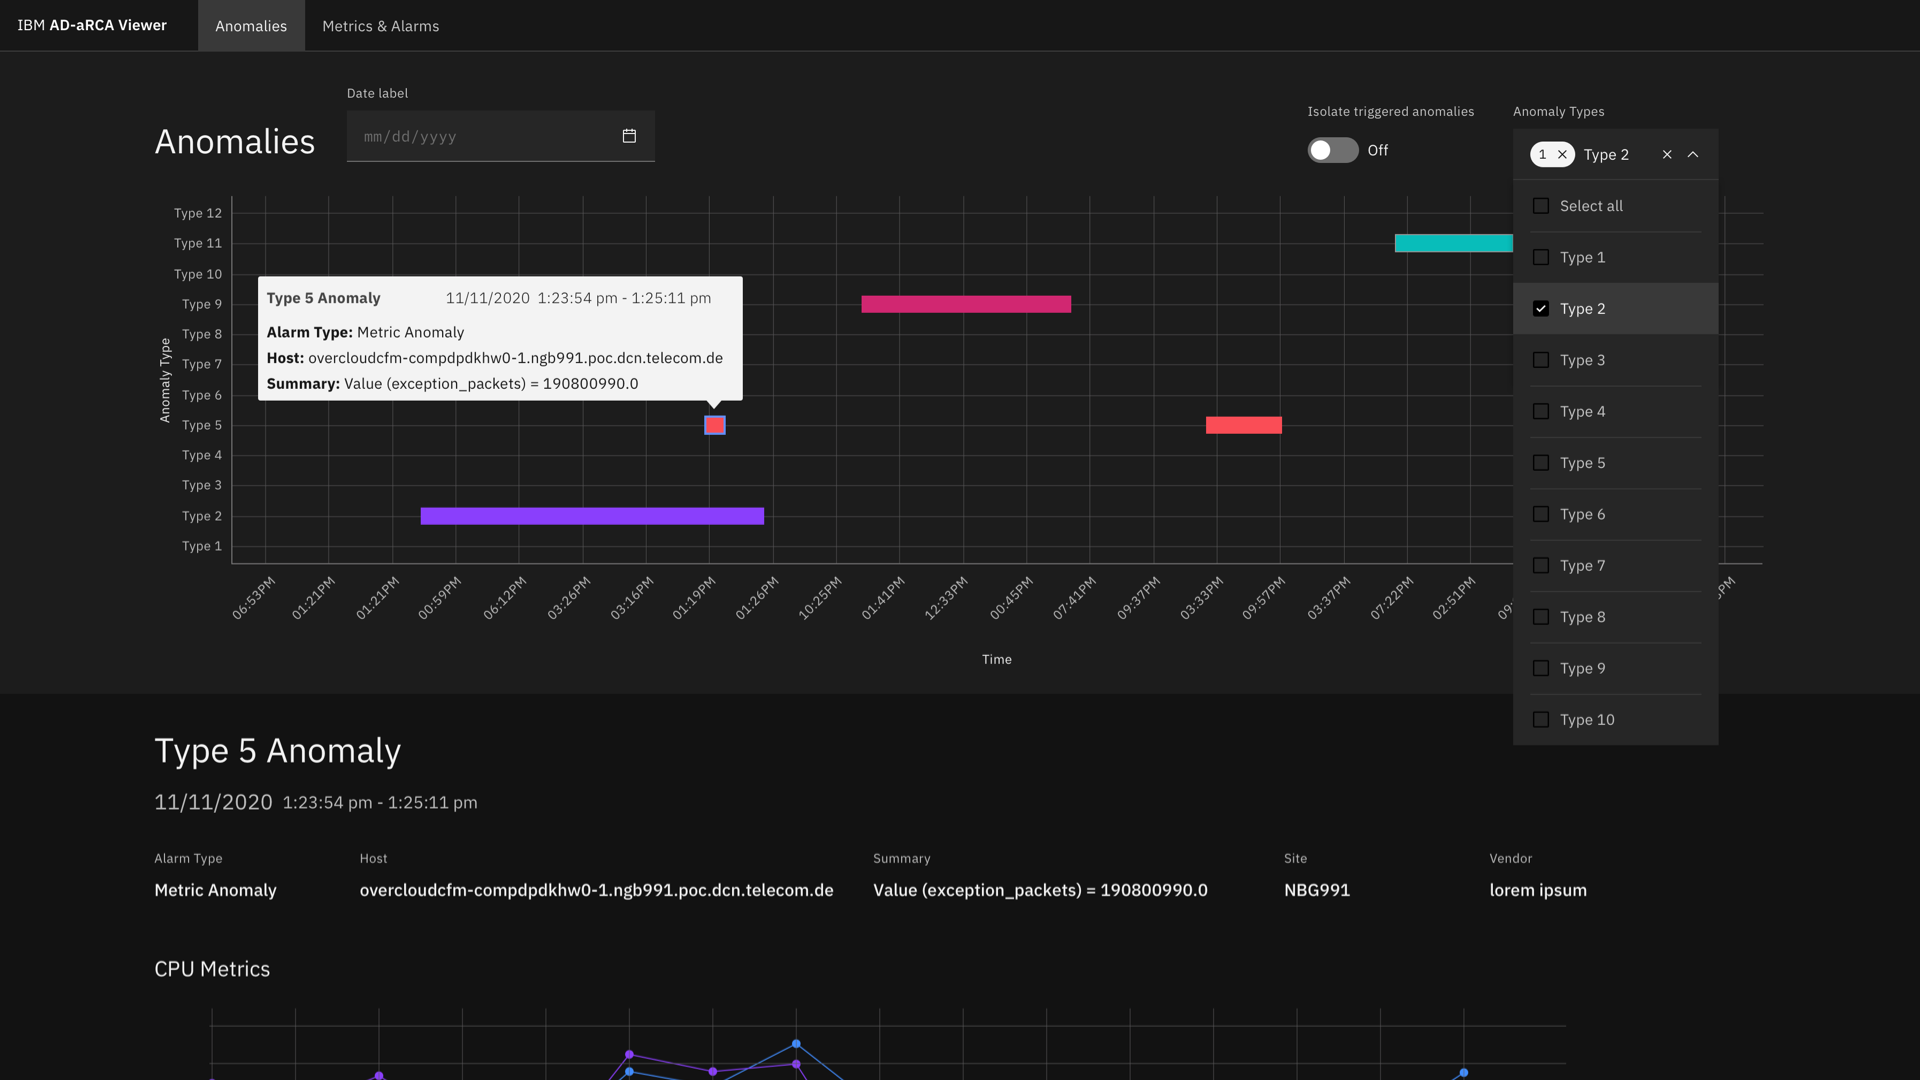
You can detect anomalies, or outliers, in your time series data by using the built-in functions in the Analytics Service catalog.
In Analytics Service, anomaly detection is used to find patterns in your time series data that do not conform to expected behavior. Anomaly detection helps you to identify problems with your devices or assets early. For example, you might use an anomaly detector to identify that a critical device in a mechanical chain is failing before the device impacts the entire chain.
Analytics Service uses several anomaly models to detect and alert on anomaly conditions, such as the following examples:
A faulty sensor is not sending data. The condition might manifest as a flat line on a graph.
A device is malfunctioning or requires a battery replacement.
You might see a vertical line on a line graph, or you might see that a peak value is exceeded or that the lowest minimum value is exceeded.A piece of equipment is out of calibration. A steady or flat line on a graph might become noisy.
A piece of equipment is not performing as expected. A target variable that is correlated with dependent variables is not within its predicted range.
What is the problem?
Remote work among knowledge workers has been on the rise for years, but many industries, especially prior to the COVID-19 pandemic, maintained a primarily "brick-and-mortar" approach in terms of knowledge worker locality. The arrival of the pandemic sent many of these workers into remote roles, placing strain on systems (such as VPNs) that might not have been optimized for this increased load. Enterprise IT organizations, such as the one these authors belong to, scrambled to reconfigure resources for this new, remote dynamic.
Workers who shifted to home offices also face an increased number of variables in accessing enterprise IT systems. There are now multiple ISPs, geographies, time zones and weather patterns involved (consider hurricanes on the US east coast and forest fires on the US west coast). There is also non-standard equipment, such as personal routers and modems, to consider. Remote work, with its many upsides, contains many variables. This creates a complex environment to navigate.
Hypothesis
If the burden of sending real time signals that mirror user behavior can be acquired by client systems and that signal pattern can be translated into a model, then anomalies in basic system access can be detected and used to determine if system access by users is currently impaired or has been impaired in the past.
Assumptions

Our hypothesis depends on two assumptions. The first assumption is that clients can take on the burden of signaling in real time. This requires that each system broadcasts a signal to a listening endpoint at some level of granularity great enough to accurately state that the client is connected (or “up”, as the common vernacular goes). This assumption itself presumes the broadcast signals mirror real user behavior. The second assumption is that these signal patterns can be modeled in such a way that an anomaly (e.g. weak client signal patterns) can be detected in real time and then be utilized to identify a system outage.
Direction
The approach we are recommending does not seek to disqualify these monitoring patterns. We do suggest, however, the following addendum to our hypothesis above: To maximally measure a population’s user experience in real time, it is essential that measurements be taken as close to the physical user as possible. In this case, we are utilizing signal generators within each user’s browser, which is much closer to the user than a distant monitoring client2 or even the backend logging system monitoring the system’s inner workings.
