03 / IBM · Sugar Creek Brewery · 2018
A Watson IoT and computer vision system with Bosch that watches every bottle leaving the line and turns handwritten readings into a live brewhouse dashboard.
Role
Lead UX/UI Designer
Team
IBM iX and Bosch engineering, with Sugar Creek brewers and owners
Duration
One quarter, on-site and remote
Platforms
Web dashboard · Watson IoT · Computer vision instrumentation
Problem
A local brewery was losing thirty thousand dollars a month to bad bottling runs.
Sugar Creek Brewing's fill levels drifted across runs, and some packaging cycles ended in heavy foaming. Foaming meant waste, but it also meant elevated dissolved oxygen, which quietly ruins flavor and shortens shelf life. Overfilled and underfilled bottles had to be uncapped, cleaned, delabeled, and sent back through the line.
The owners tracked what they could by reading gauges and filling binders with handwritten numbers. What they needed was a system that watched every bottle so they could watch the business.
Discovery
Requirements gathered on the brewhouse floor, not in a conference room.
We met the Sugar Creek team at their brewery to gather requirements for the project. While there, I spoke with multiple Sugar Creek employees, including management and owners, brewers, and other staff, along with the IBM project lead. Those conversations gave us insight into their brewing process, the inefficiencies they had noticed, and the tools IBM could provide to help.
I also observed and documented their brewing and bottling process first-hand, taking note of opportunities to implement analytics, automation, and other possible solution areas.
Define
Learning the brewer's language before designing a single screen.
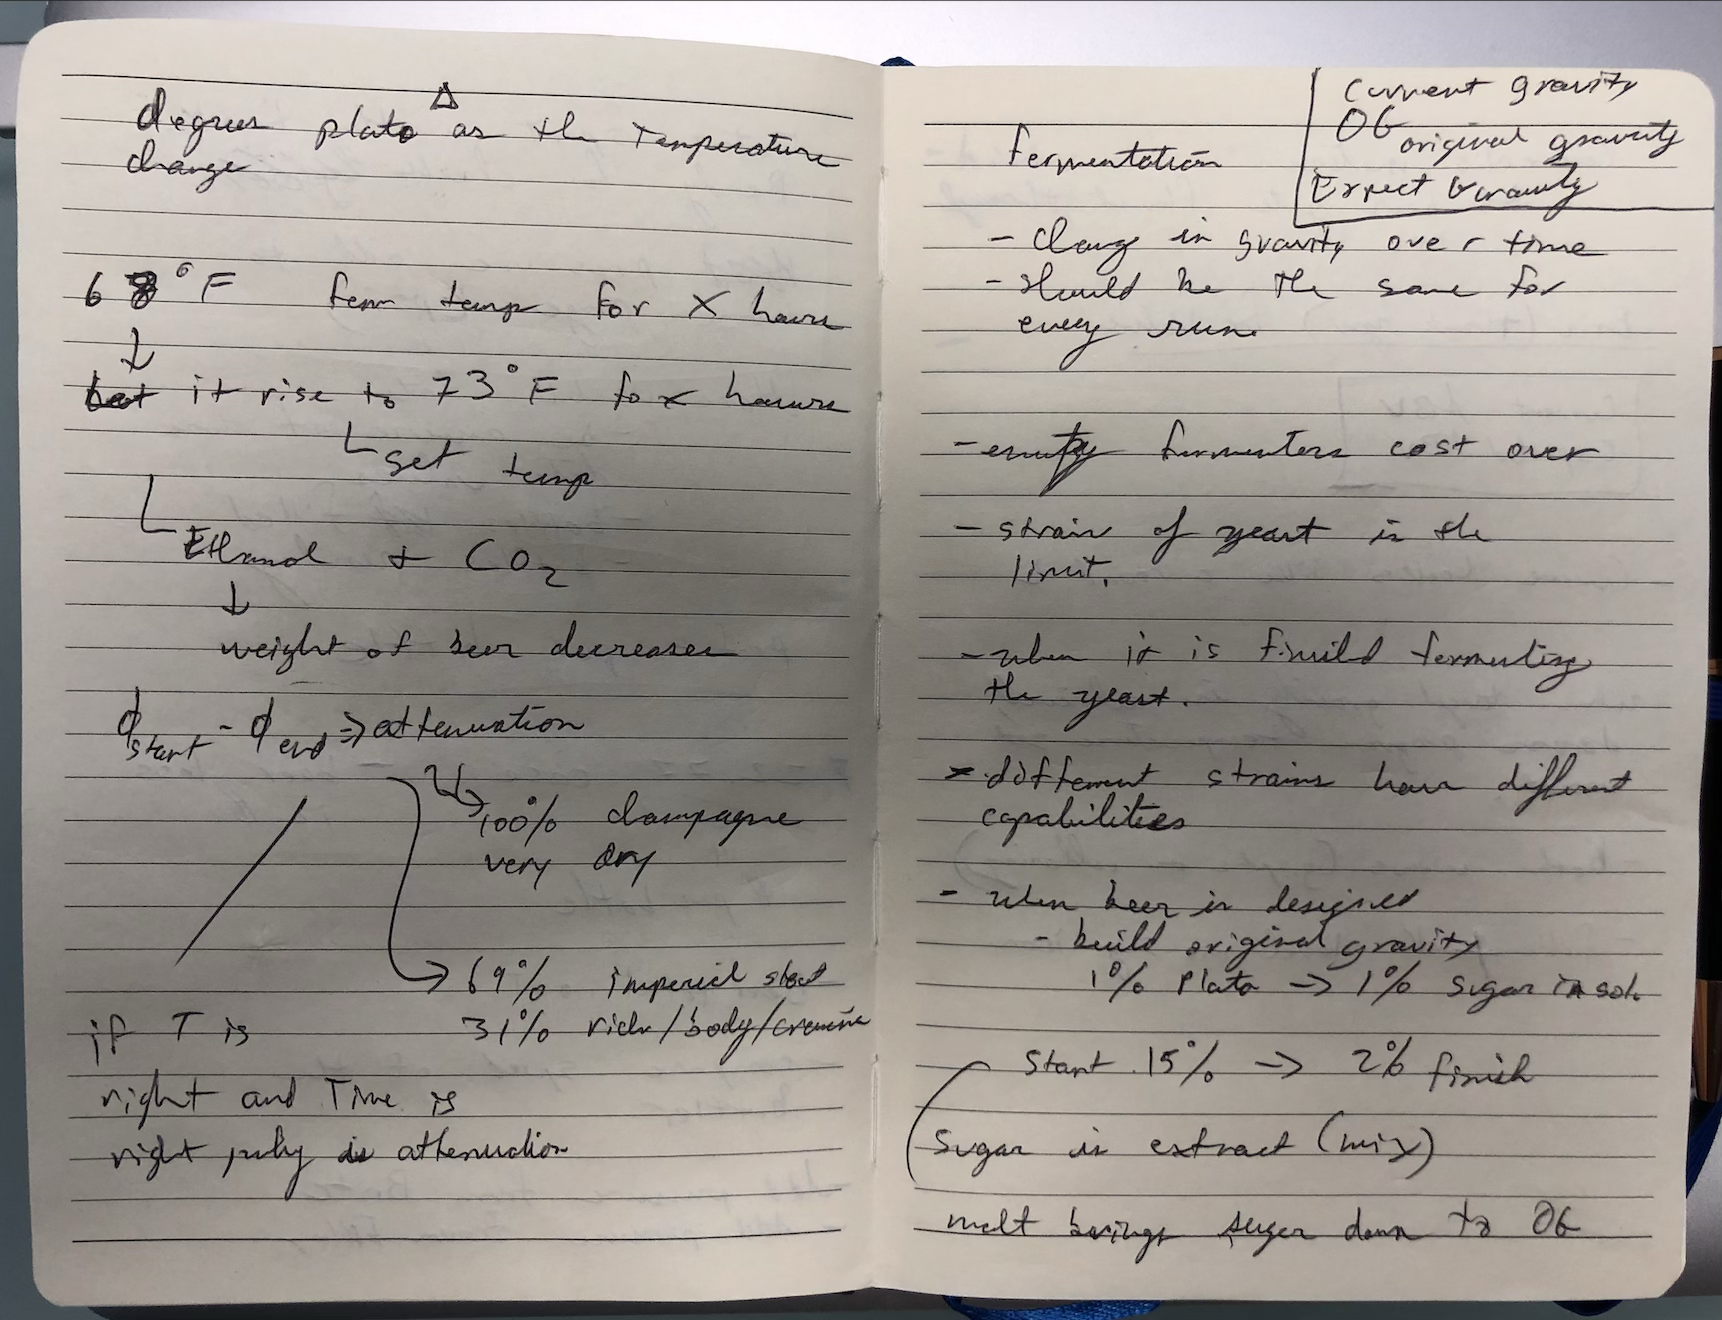
Before any interface work, I sat with the brewmaster and filled a notebook with how beer is actually measured: degrees Plato as temperature changes, fermentation held at 68F for a set window then allowed to rise to 73F, ethanol and CO2 leaving the tank so the weight of the beer drops, and the gap between starting and ending gravity that brewers call attenuation.
Those notes became the definition of the product. Original gravity, current gravity, expected gravity, and attenuation targets set the metrics on the dashboard, and the brewer's rule that every run should track the same gravity curve became the anomaly Watson was asked to watch for.
Taking this raw information, I facilitated further discussions with the owners and project lead to define the most important measures to track, surface opportunity areas nobody had considered, and form a rough idea of what the final product needed to accomplish.
Sugar Creek had no established method for using these data points, so by analyzing the brewing environment, the data collected by the IoT devices, and the information already available through normal production, we built a clear plan of attack and information architecture for the dashboard.
Design
Whiteboarding the visualizations before building them.
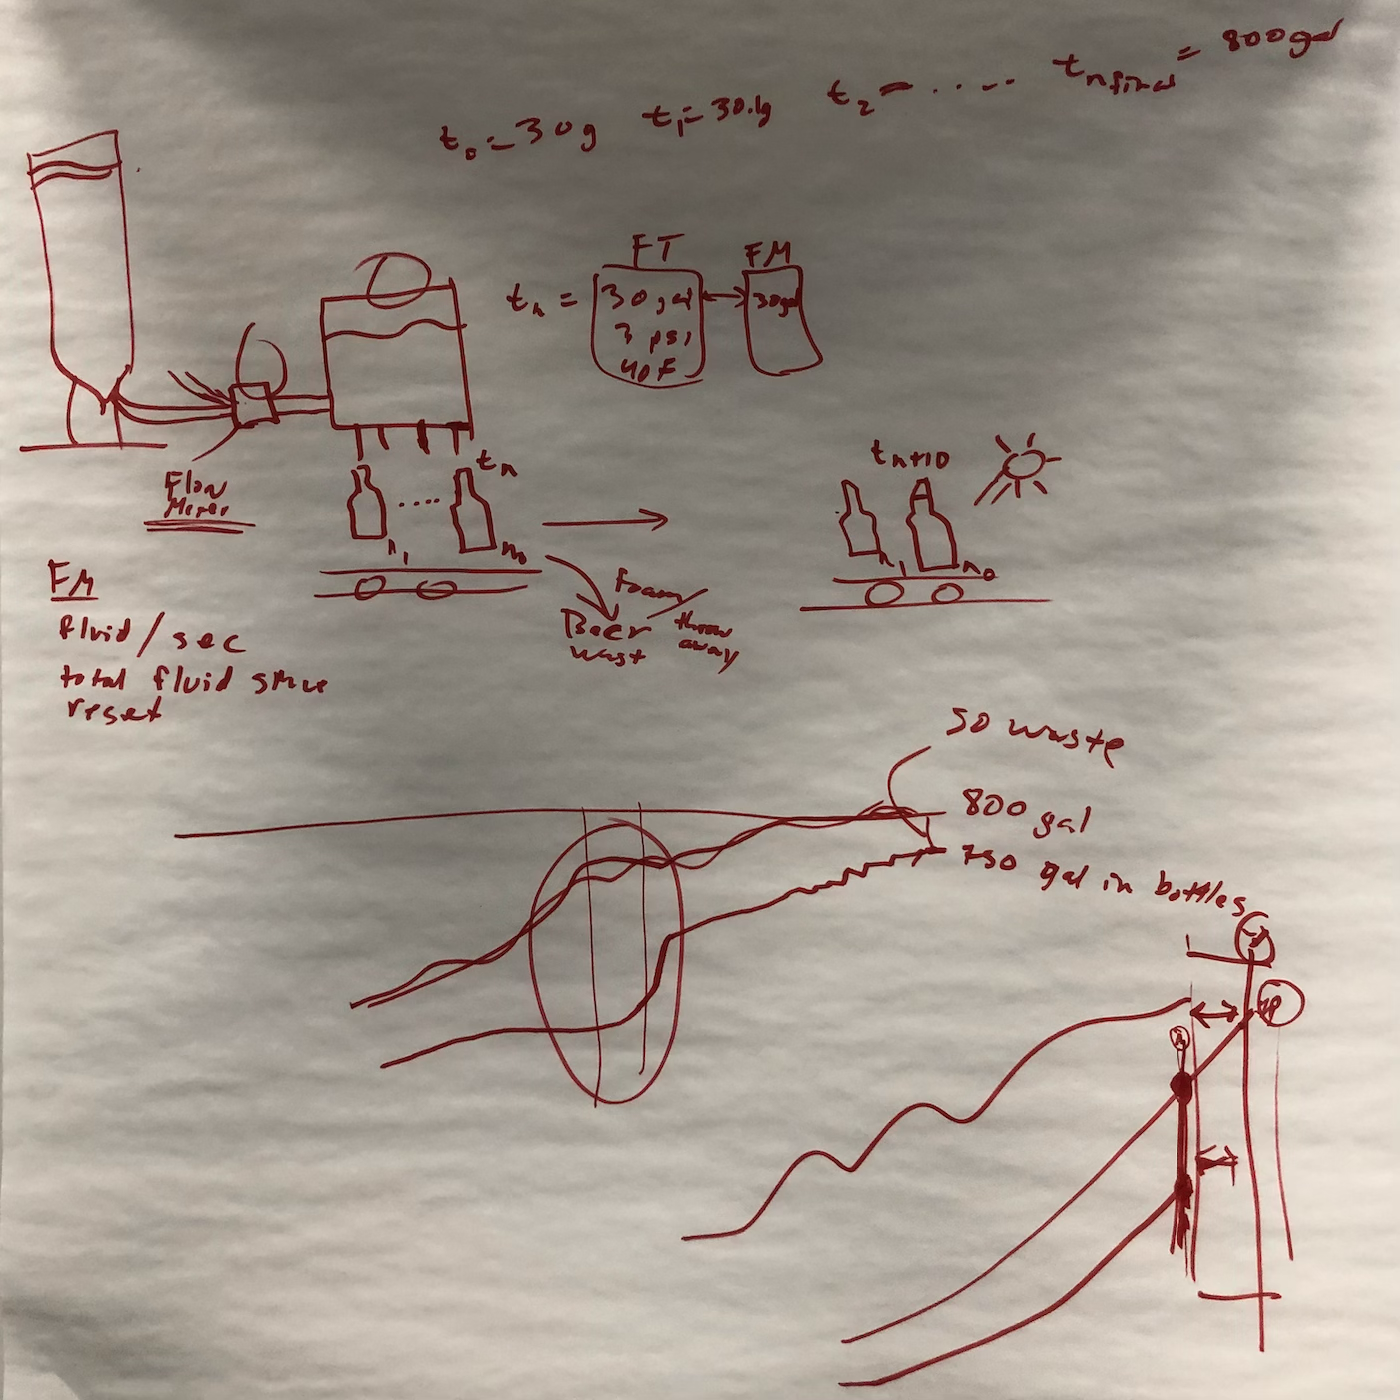
I then worked alongside the lead developer in whiteboarding multiple methods of data visualization for a dashboard analyzing the amount of beer flowing through a bottling cycle, the height each bottle is filled at to avoid wasted product, and other metrics around the brewing process like fermentation tracking, remote temperature control, and more.
After validating the requirements of the visualizations and information architecture with the stakeholders and brewery owners, we got to work to design, develop, and deliver the functional interface within the confines of our budget and limited timeline.
Process
Ethnographic research on the brewhouse floor, then a dashboard built around what brewers actually track.
01 · On-site research
Spent days at the brewery observing the full brewing and bottling cycle, interviewing the brewmaster and owners, and documenting the moments where waste and oxygen crept in.
02 · Instrument the line
Worked with Bosch to place a camera at the exit of the bottle line and precision sensors across the brewhouse, streaming 24/7 telemetry into IBM Cloud alongside the vision data.
03 · Metrics that matter
Facilitated sessions with owners and brewers to define the fill, foam, fermentation, and temperature signals worth watching, and tied each one back to lost revenue.
04 · Data visualization
Whiteboarded with the lead developer, then designed fill-height charts, fermentation curves, and remote temperature controls that Watson could annotate as anomalies appeared.
05 · Ship inside constraints
Handed off a tight, functional UI within a compressed timeline and budget, keeping every surface legible on the brewhouse floor and reachable from any device on a secure connection.
Use cases
Screens from the shipped dashboard.
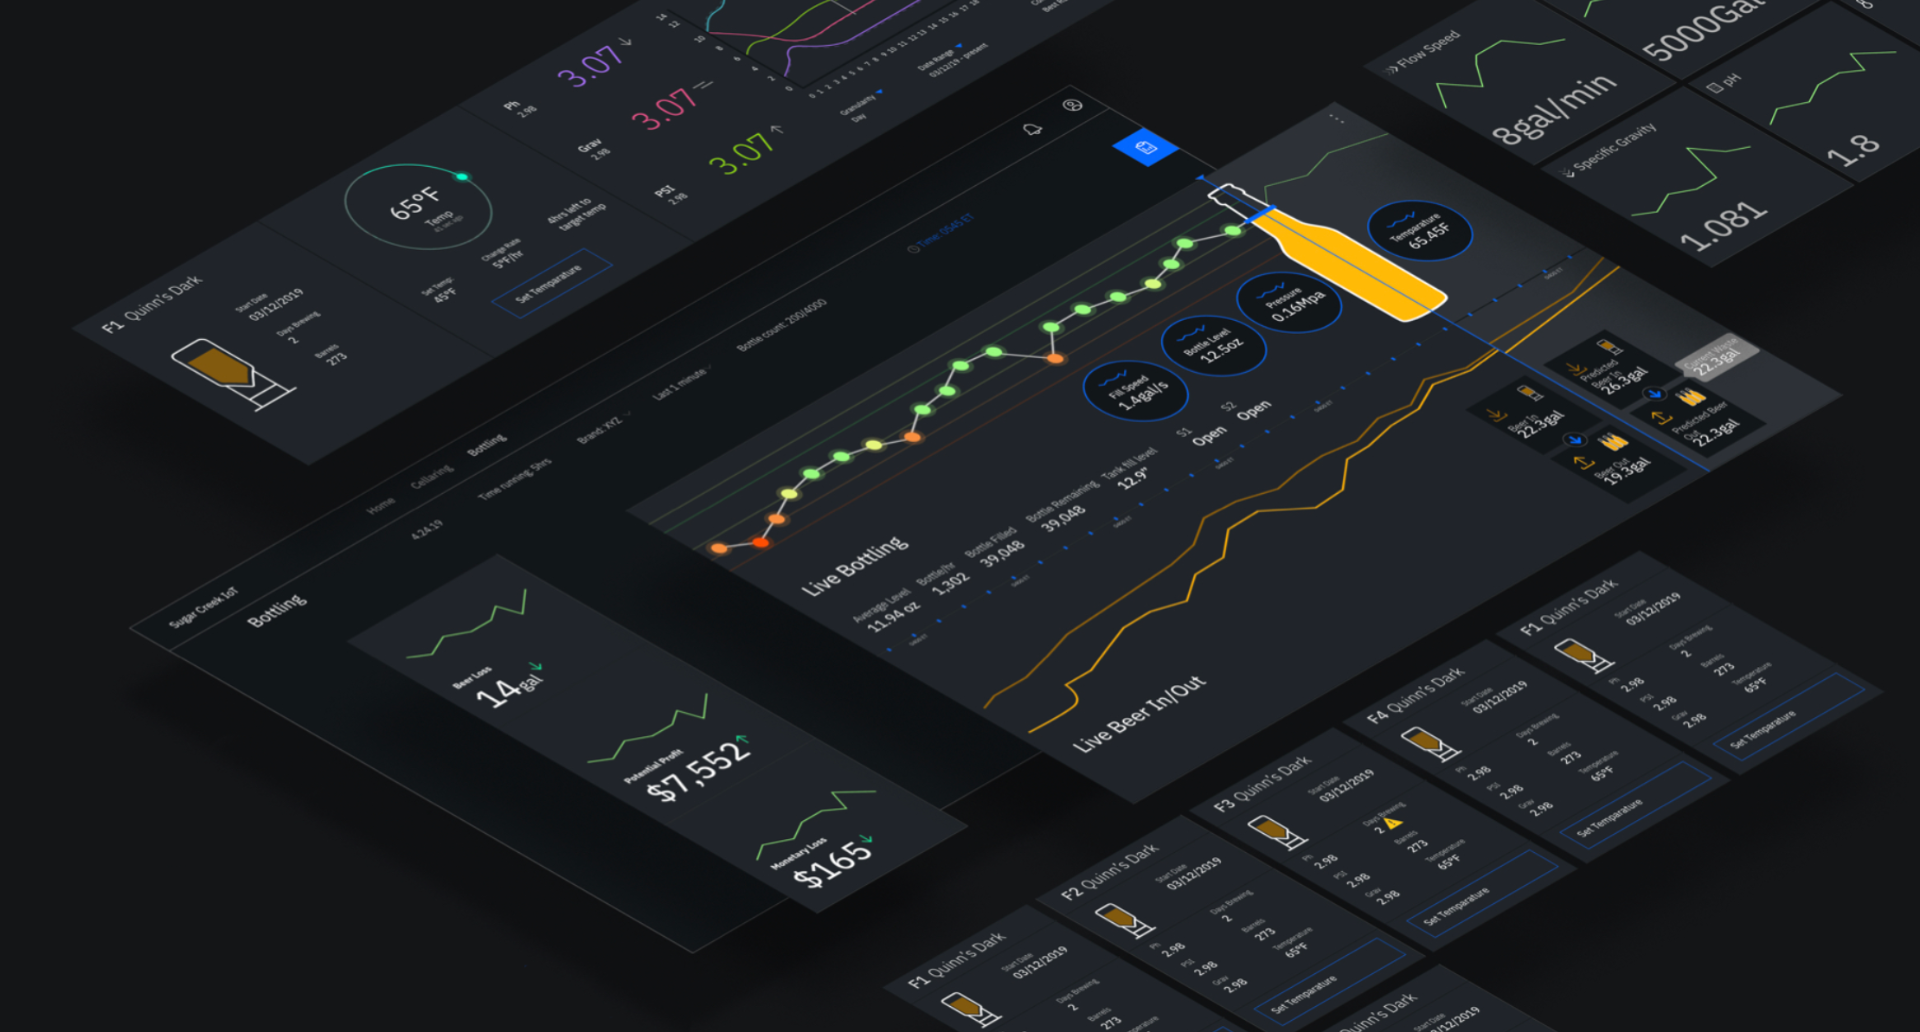
Bottling and fermentation at a glance
The primary dashboard collapses fill-height variance, fermentation state, and tank temperatures into a single glanceable surface.
Operator UI on the brewhouse floor
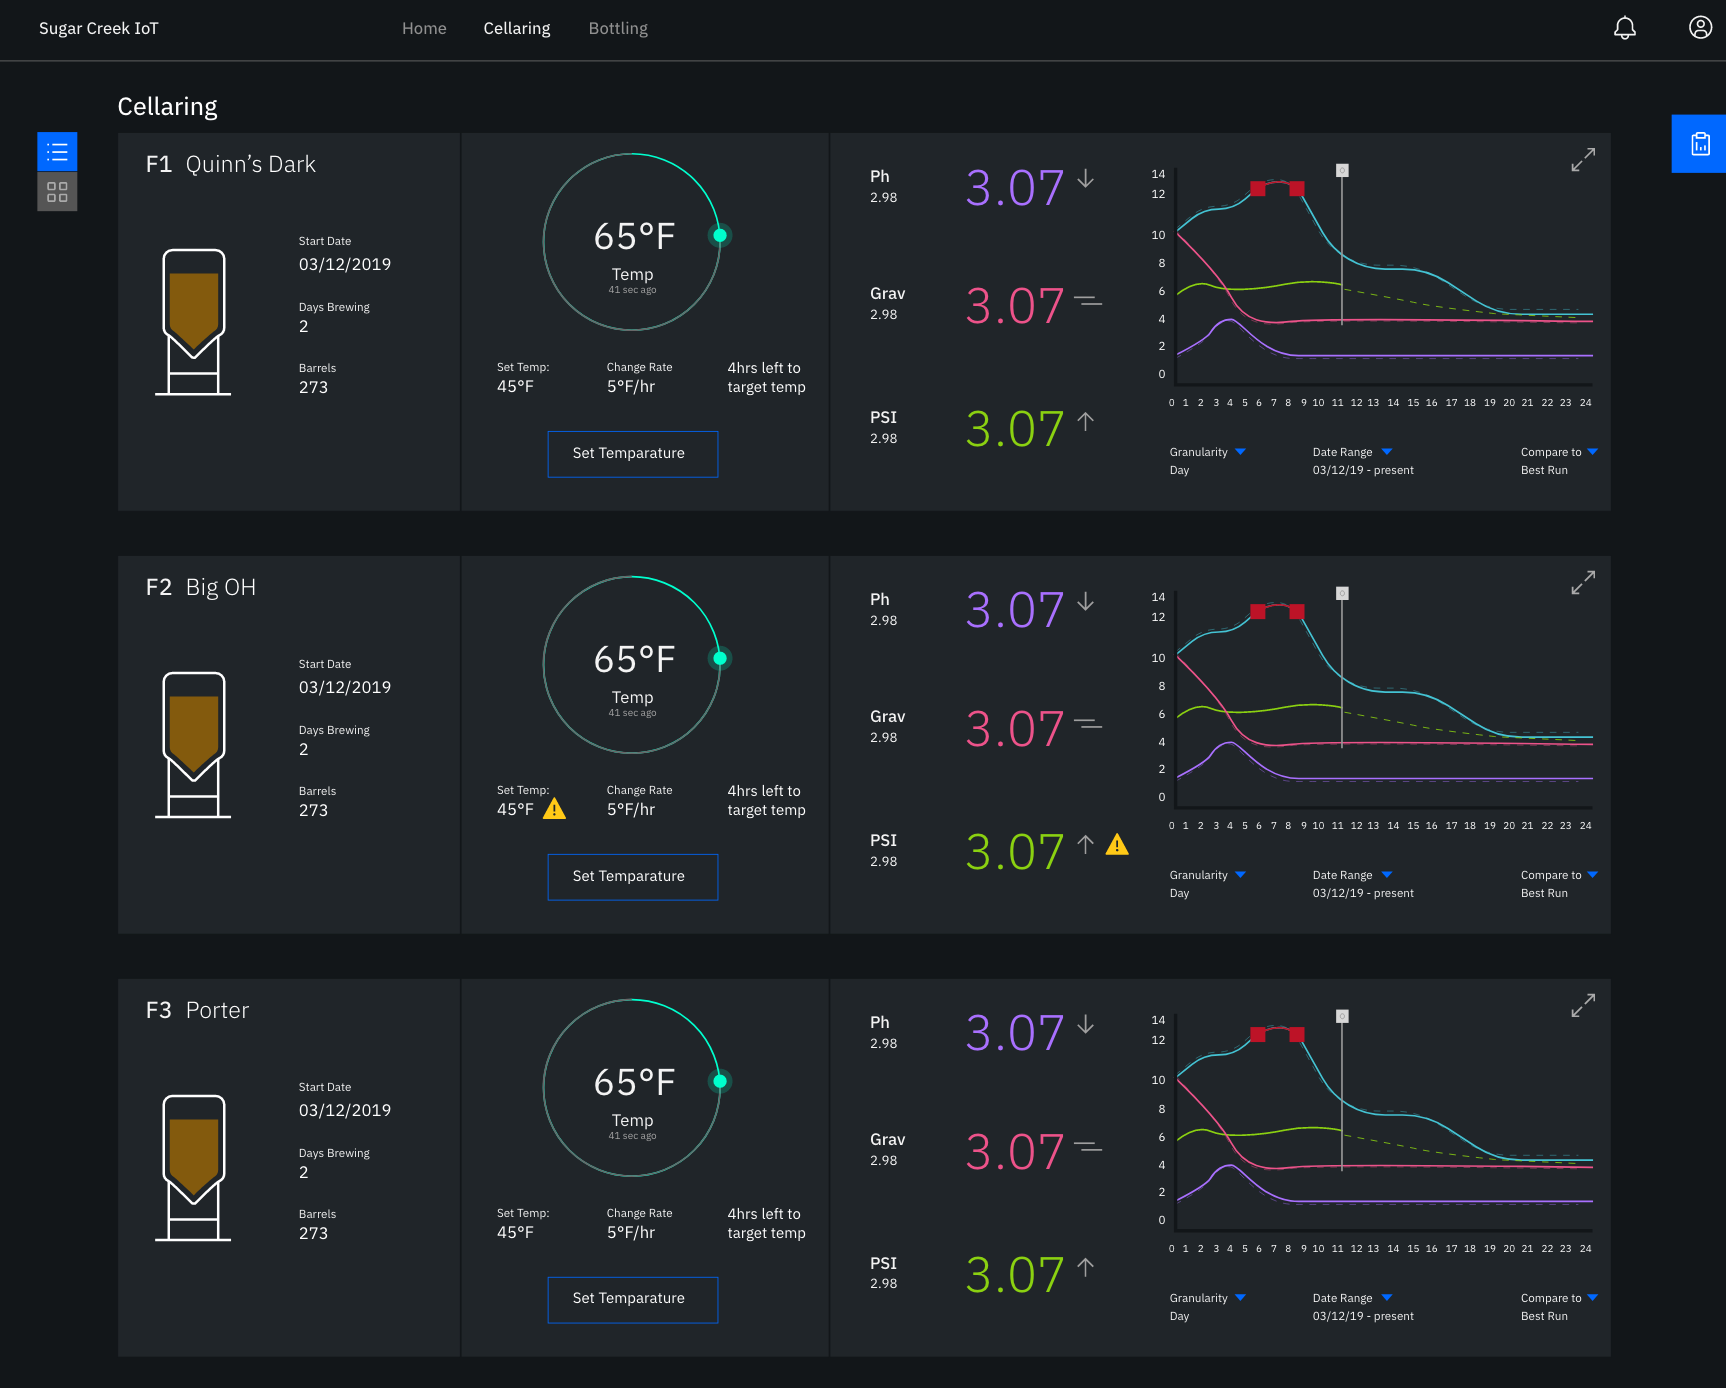
Detail views for individual runs and tanks, designed to stay legible on the floor and support quick action when a metric drifts.
Results
Real savings for a small business, and a flagship story for IBM IoT.
$10K
saved per month
$30K
monthly spillage identified
24/7
sensor coverage
Solving the foaming problem alone recovered about ten thousand dollars a month for Sugar Creek, out of thirty thousand in monthly spillage the team could finally see. The brewhouse moved from binders and eyeball gauge reads to calibrated, always-on data, and the project was featured at the 2018 IBM IoT Exchange and covered by Forbes as a marquee example of AI plus IoT in a working craft brewery.
Next case study
Design system governance at scale
IBM · Carbon